Normally, Python programming errors result in an exception like this:
% python foo.py
Traceback (innermost last):
  File "foo.py", line 11, in ?
    foo()
  File "foo.py", line 8, in foo
    bar()
  File "foo.py", line 5, in bar
    spam()
  File "foo.py", line 2, in spam
    doh()
NameError: doh
%
Needless to say, this isn't very informative--well, other than indicating that something ``very bad'' happened.% python foo.py Segmentation Fault (core dumped) %
In order to identify the source of a fatal error, a programmer can run a debugger on the Python executable or on a core file like this:
% gdb /usr/local/bin/python
(gdb) run foo.py
Starting program: /usr/local/bin/python foo.py

Program received signal SIGSEGV, Segmentation fault.
0xff060568 in doh () from /u0/beazley/Projects/WAD/Python/./libfoo.so
(gdb) where
#0  0xff060568 in doh () from /u0/beazley/Projects/WAD/Python/./libfoo.so
#1  0xff082f34 in _wrap_doh ()
   from /u0/beazley/Projects/WAD/Python/./dohmodule.so
#2  0x2777c in call_builtin (func=0x1984b8, arg=0x1a1ccc, kw=0x0)
    at ceval.c:2650
#3  0x27648 in PyEval_CallObjectWithKeywords (func=0x1984b8, arg=0x1a1ccc,
    kw=0x0) at ceval.c:2618
#4  0x25d18 in eval_code2 (co=0x19acf8, globals=0x0, locals=0x1c7844,
    args=0x1984b8, argcount=1625472, kws=0x0, kwcount=0, defs=0x0, defcount=0,
    owner=0x0) at ceval.c:1951
#5  0x25954 in eval_code2 (co=0x199620, globals=0x0, locals=0x1984b8,
    args=0x196654, argcount=1862720, kws=0x197788, kwcount=0, defs=0x0,
#6  0x25954 in eval_code2 (co=0x19ad38, globals=0x0, locals=0x196654,
    args=0x1962fc, argcount=1862800, kws=0x198e90, kwcount=0, defs=0x0,
    defcount=0, owner=0x0) at ceval.c:1850
#7  0x25954 in eval_code2 (co=0x1b6c60, globals=0x0, locals=0x1962fc,
    args=0x1a1eb4, argcount=1862920, kws=0x0, kwcount=0, defs=0x0, defcount=0,
    owner=0x0) at ceval.c:1850
#8  0x22da4 in PyEval_EvalCode (co=0x1b6c60, globals=0x1962c4, locals=0x1962c4)
    at ceval.c:319
#9  0x3adb4 in run_node (n=0x18abf8, filename=0x1b6c60 "", globals=0x1962c4,
    locals=0x1962c4) at pythonrun.c:886
#10 0x3ad64 in run_err_node (n=0x18abf8, filename=0x1b6c60 "",
    globals=0x1962c4, locals=0x1962c4) at pythonrun.c:874
#11 0x3ad38 in PyRun_FileEx (fp=0x18a5a8, filename=0xffbefd7a "foo.py",
    start=1616888, globals=0x1962c4, locals=0x1962c4, closeit=1)
    at pythonrun.c:866
#12 0x3a1d8 in PyRun_SimpleFileEx (fp=0x18a5a8, filename=0xffbefd7a "foo.py",
    closeit=1) at pythonrun.c:579
#13 0x39d84 in PyRun_AnyFileEx (fp=0x18a5a8, filename=0xffbefd7a "foo.py",
    closeit=1) at pythonrun.c:459
#14 0x1f498 in Py_Main (argc=2, argv=0xffbefc84) at main.c:289
#15 0x1eec0 in main (argc=2, argv=0xffbefc84) at python.c:10
Normally, extension developers try to avoid catastrophic errors by adding error handling. If an application is small or customized for use with Python, it can be modified to raise Python exceptions. Automated tools such as SWIG can also convert C++ exceptions and C-related error handling mechanisms into Python exceptions. However, no matter how much error checking is added, there is always a chance that an extension will fail in an unexpected manner. This is especially true for large applications that have been wrapped into an extension module. In addition, certain types of errors such as floating point exceptions (e.g., division by zero) are especially difficult to find and eliminate. Finally, rigorous error checking may be omitted to improve performance.
To address these problems, an experimental module known as WAD (Wrapped Application Debugger) has been developed. WAD is able to convert fatal errors into Python exceptions that include information from the call stack as well as debugging information. By turning such errors into Python exceptions, fatal errors now result in a traceback that crosses the boundary between Python code and compiled extension code. This makes it much easier to identify and correct extension-related programming errors. WAD requires no modifications to Python and is compatible with all extension modules. However, it is also highly platform specific and currently only runs on Sun Sparc Solaris and i386-Linux. The primary goal of this paper is to motivate the problem and to describe one possible solution. In addition, many of the implementation issues associated with providing an integrated error reporting mechanism are described.
To identify the problem, a programmer can run Python interactively and import WAD as follows:% python foo.py Segmentation Fault (core dumped) %
% python
Python 2.0 (#1, Oct 27 2000, 14:34:45)
[GCC 2.95.2 19991024 (release)] on sunos5
Type "copyright", "credits" or "license" for more information.
>>> import libwadpy
WAD Enabled
>>> execfile("foo.py")
Traceback (most recent call last):
  File "", line 1, in ?
  File "foo.py", line 16, in ?
    foo()
  File "foo.py", line 13, in foo
    bar()
  File "foo.py", line 10, in bar
    spam()
  File "foo.py", line 7, in spam
    doh.doh(a,b,c)
SegFault: [ C stack trace ]

#2   0x00027774 in call_builtin(func=0x1c74f0,arg=0x1a1ccc,kw=0x0)
#1   0xff022f7c in _wrap_doh(0x0,0x1a1ccc,0x160ef4,0x9c,0x56b44,0x1aa3d8)
#0   0xfe7e0568 in doh(a=0x3,b=0x4,c=0x0) in 'foo.c', line 28

/u0/beazley/Projects/WAD/Python/foo.c, line 28

    int doh(int a, int b, int *c) {
 =>   *c = a + b;
      return *c;
    }

>>>
In certain applications, it may be difficult to run Python interactively or to modify the code to explicitly import a special debugging module. In these cases, WAD can be attached to an extension module with the linker. For example:
This requires no recompilation of any source code--only a relinking of the extension module. When Python loads the relinked extension module, WAD is automatically initialized before Python invokes the module initialization function.% ld -G $(OBJS) -o dohmodule.so -lwadpy
A secondary design goal is to provide a system that is as non-invasive as possible. The system should not require modifications to Python or any extension modules and it should be easy to integrate into the runtime environment of an application. In addition, it shouldn't introduce any performance overhead.
Finally, since WAD co-exists with the Python interpreter (i.e., in the same process), there are a number of technical issues that have to be addressed. First, fatal errors can theoretically occur anywhere in the interpreter as well as in extension modules. Therefore, WAD needs to know about Python's internal organization if it is going to provide a graceful recovery back to the interpreter. Second, in order to implement this recovery scheme, the system has to perform direct manipulation of the CPU context and call stack. Last, but not least, since the recovery code lives in the same address space as the interpreter and extension modules it should not depend on the process stack and heap (since both could have been corrupted by the faulting application).
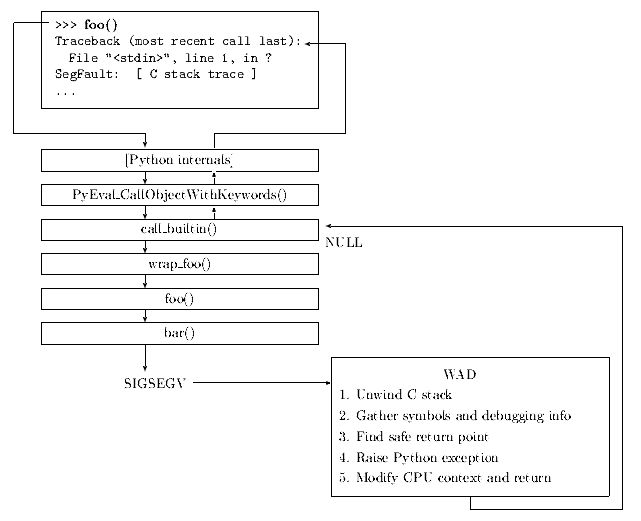
The services of WAD are only invoked upon the reception of a fatal signal. This triggers a signal handling function that results in a return to Python as illustrated in the following figure:
The steps required to implement this recovery are as follows:
Address     Size    Permissions        File
----------  -----   -----------------  ---------------------------------
00010000    1264K   read/exec         /usr/local/bin/python
0015A000     184K   read/write/exec   /usr/local/bin/python
00188000     296K   read/write/exec     [ heap ]
FE7C0000      32K   read/exec         /u0/beazley/Projects/dohmodule.so
FE7D6000       8K   read/write/exec   /u0/beazley/Projects/dohmodule.so
...
FF100000     664K   read/exec         /usr/lib/libc.so.1
FF1B6000      24K   read/write/exec   /usr/lib/libc.so.1
FF1BC000       8K   read/write/exec   /usr/lib/libc.so.1
FF2C0000     120K   read/exec         /usr/lib/libthread.so.1
FF2EE000       8K   read/write/exec   /usr/lib/libthread.so.1
FF2F0000      48K   read/write/exec   /usr/lib/libthread.so.1
FF310000      40K   read/exec         /usr/lib/libsocket.so.1
FF32A000       8K   read/write/exec   /usr/lib/libsocket.so.1
FF330000      24K   read/exec         /usr/lib/libpthread.so.1
FF346000       8K   read/write/exec   /usr/lib/libpthread.so.1
FF350000       8K   read/write/exec    [ anon ]
FF3B0000       8K   read/exec         /usr/lib/libdl.so.1
FF3C0000     128K   read/exec         /usr/lib/ld.so.1
FF3E0000       8K   read/write/exec   /usr/lib/ld.so.1
FFBEA000      24K   read/write/exec    [ stack ]
long *pc = get_pc(context);
long *sp = get_sp(context);
while (sp) {
    /* Move to previous stack frame */
    pc = (long *) sp[15];      /* %i7 register on SPARC */
    sp = (long *) sp[14];      /* %i6 register on SPARC */
}
To find a match for a virtual memory address addr, WAD simply searches for a symbol s such that base + s.offset <= addr < base + s.offset + s.size, where base is the base virtual address of the object file in the virtual memory map.Offset Size Name -------- ------ --------- 0x1280 324 wrap_foo 0x1600 128 foo 0x2408 192 bar ...
Debugging information, if available, is scanned to identify a source file, function name, and line number. This involves scanning object files for a table of debugging information stored in a format known as ``stabs.''. Stabs is a relatively simple, but highly extensible format that is language independent and capable of encoding almost every aspect of the original source code. For the purposes of WAD, only a small subset of this data is actually used.
The following table shows a small fragment of relevant stabs data:
In the table, the type field indicates the type of debugging information. For example, 0x64 specifies the source file, 0x24 is a function definition, 0xa0 is a function parameter, and 0x44 is line number information. Associated with each stab is a collection of parameters and an optional string. The string usually contains symbol names and other information. The desc and value fields are numbers that usually contain byte offsets and line number data. Therefore, to collect debugging information, WAD simply walks through the debugging tables until it finds the function of interest. Once found, parameter and line number specifiers are inspected to determine the location and values of the function arguments as well the source line at which the error occurred.type desc value string description ------ ----- --------- --------------------------- ----------- 0x64 0 0 /u0/beazley/Projects/foo/ Pathname 0x64 0 0 foo.c Filename ... 0x24 0 0 foo:F(0,3);(0,3) Function 0xa0 4 68 n:p(0,3) Parameter ... 0x44 6 8 Line number 0x44 7 12 Line number 0x44 8 44 Line number 0x44 9 56 Line number ...
The symbols in this table correspond to functions within the Python interpreter that might execute extension code and include the parts of the interpreter that invoke builtin functions as well as the functions from the abstract object interface. If any of these symbols appear on the call stack, a handler function is invoked to raise a Python exception. This handler function is given a WAD-specific traceback object that contains a copy of the call stack and CPU registers as well as any symbolic and debugging information that was obtained. If none of the symbolic return points are encountered, WAD invokes a default handler that simply prints the full C stack trace and generates a core file.Python symbol Return value ----------------------------- ------------------ call_builtin NULL _PyImport_LoadDynamicModule NULL PyObject_Repr NULL PyObject_Print -1 PyObject_CallFunction NULL PyObject_CallMethod NULL PyObject_CallObject NULL PyObject_Cmp -1 PyObject_Compare -1 PyObject_DelAttrString -1 PyObject_DelItem -1 PyObject_GetAttrString NULL PyObject_GetItem NULL PyObject_HasAttrString -1 PyObject_Hash -1 PyObject_Length -1 PyObject_SetAttrString -1 PyObject_SetItem -1 PyObject_Str NULL PyObject_Type NULL ... PyEval_EvalCode NULL
The most complicated part of modifying the CPU context is that of restoring previously saved CPU registers. By manually unwinding the call stack, the WAD exception handler effectively performs the same operation as a longjmp() call in C. However, unlike longjmp(), no previously saved set of CPU registers are available from which to resume execution in the Python interpreter. The solution to this problem depends entirely on the underlying architecture. On the SPARC, register values are saved in register windows which WAD manually unwinds to restore the proper state. On the Intel, the solution is much more interesting. To restore the register values, WAD must manually inspect the machine instructions of each function on the call stack in order to find out where the registers might have been saved. This information is then used to restore the registers from their saved locations before returning to the Python interpreter.
class WadInit {
public:
    WadInit() {
        wad_init();   /* Call the real initialization function */
    }
};
static WadInit wad_initializer;
When the dynamic loader brings WAD into memory, it automatically
executes the constructors of all statically allocated C++ objects.
Therefore, this initialization code executes immediately after
loading, but before Python actually calls the module initialization
function. As a result, when an extension module is linked with WAD,
the debugging capability is enabled before any other operations occur---this
allows WAD to respond to fatal errors that might occur during module
initialization.
The rest of the initialization process consists of the following:
Although there are libraries such as GNU bfd that can assist with the reading of object files, none of these are used in the implementation [10]. First, these libraries tend to be quite large and are oriented more towards stand-alone tools such as debuggers, linkers, and compilers. Second, due to usual nature of the runtime environment and the restrictions on memory utilization (no heap, no stack), the behavior of these libraries is somewhat unclear and would require further study. Finally, given the small size of the prototype implementation, it didn't seem necessary to rely on a large general purpose library.
void *Malloc(int size) {
   void *ptr;
   ptr = malloc(size);
   if (!ptr) throw("Out of memory");
   return ptr;
}
With respect to debuggers, quite a lot of work has been done in creating advanced debugging support for specific languages and integrated development environments. However, very little of this work has concentrated on the problem of extensible systems and compiled-interpreted language integration. For instance, debuggers for Python are currently unable to cross over into C extensions whereas C debuggers aren't able to easily extract useful information from the internals of the Python interpreter.
One system of possible interest is Rn which was developed in the mid-1980s at Rice University [12]. This system, primarily designed for working with large scientific applications written in Fortran, provided an execution monitor that consisted of a special debugging process with an embedded interpreter. When attached to compiled Fortran code, this monitor could dynamically patch the executable in a manner that allowed parts of the code to be executed in the interpreter. This was used to provide a debugging environment in which essentially any part of the compiled application could be modified at run-time by simply compiling the modified code (Fortran) to an interpreted form and inserting a breakpoint in the original executable that transferred control to the interpreter. Although this particular scheme is not directly related to the functionality of WAD, it is one of the few systems in which interpreted and compiled code have been tightly coupled within a debugging framework. Several aspects of the interpreted/compiled interface are closely related to way in which WAD operates. In addition, various aspects of this work may be useful should WAD be extended with new capabilities.
Finally, a number of extensions to the WAD approach may be possible. For example, even though the current implementation only returns a traceback string to the Python interpreter, the WAD signal handler actually generates a full traceback of the C call stack including all of the CPU registers and a copy of the stack data. Therefore, with a little work, it may be possible to implement a diagnostic tool that allows the state of the C stack to be inspected from the Python interpreter after a crash has occurred. Similarly, it may be possible to integrate the capabilities of WAD with those provided by the Python debugger.
As of this writing, WAD is still undergoing active development. However, the software is available for experimentation and download at at http://systems.cs.uchicago.edu/wad.
[2] P.F. Dubois, Climate Data Analysis Software, 8th International Python Conference, Arlington, VA. (2000).
[3] P.F. Dubois, A Facility for Creating Python Extensions in C++, 7th International Python Conference, Houston, TX. (1998).
[4] SIP. http://www.thekompany.com/projects/pykde/.
[5] FPIG. http://cens.ioc.ee/projects/f2py2e/.
[6] R. Faulkner and R. Gomes, The Process File System and Process Model in UNIX System V, USENIX Conference Proceedings, January 1991.
[7] J.R. Levine, Linkers & Loaders. Morgan Kaufmann Publishers, 2000.
[8] Free Software Foundation, The "stabs" debugging format. GNU info document.
[9] W. Richard Stevens, UNIX Network Programming: Interprocess Communication, Volume 2. PTR Prentice-Hall, 1998.
[10] S. Chamberlain. libbfd: The Binary File Descriptor Library. Cygnus Support, bfd version 3.0 edition, April 1991.
[11] M.L. Scott. Programming Languages Pragmatics. Morgan Kaufmann Publishers, 2000.
[12] A. Carle, D. Cooper, R. Hood, K. Kennedy, L. Torczon, S. Warren, A Practical Environment for Scientific Programming. IEEE Computer, Vol 20, No. 11, (1987). p. 75-89.